Special Reports
Comparative Analysis of Nigeria’s Foreign Investment Dynamics (1999 – 2026)

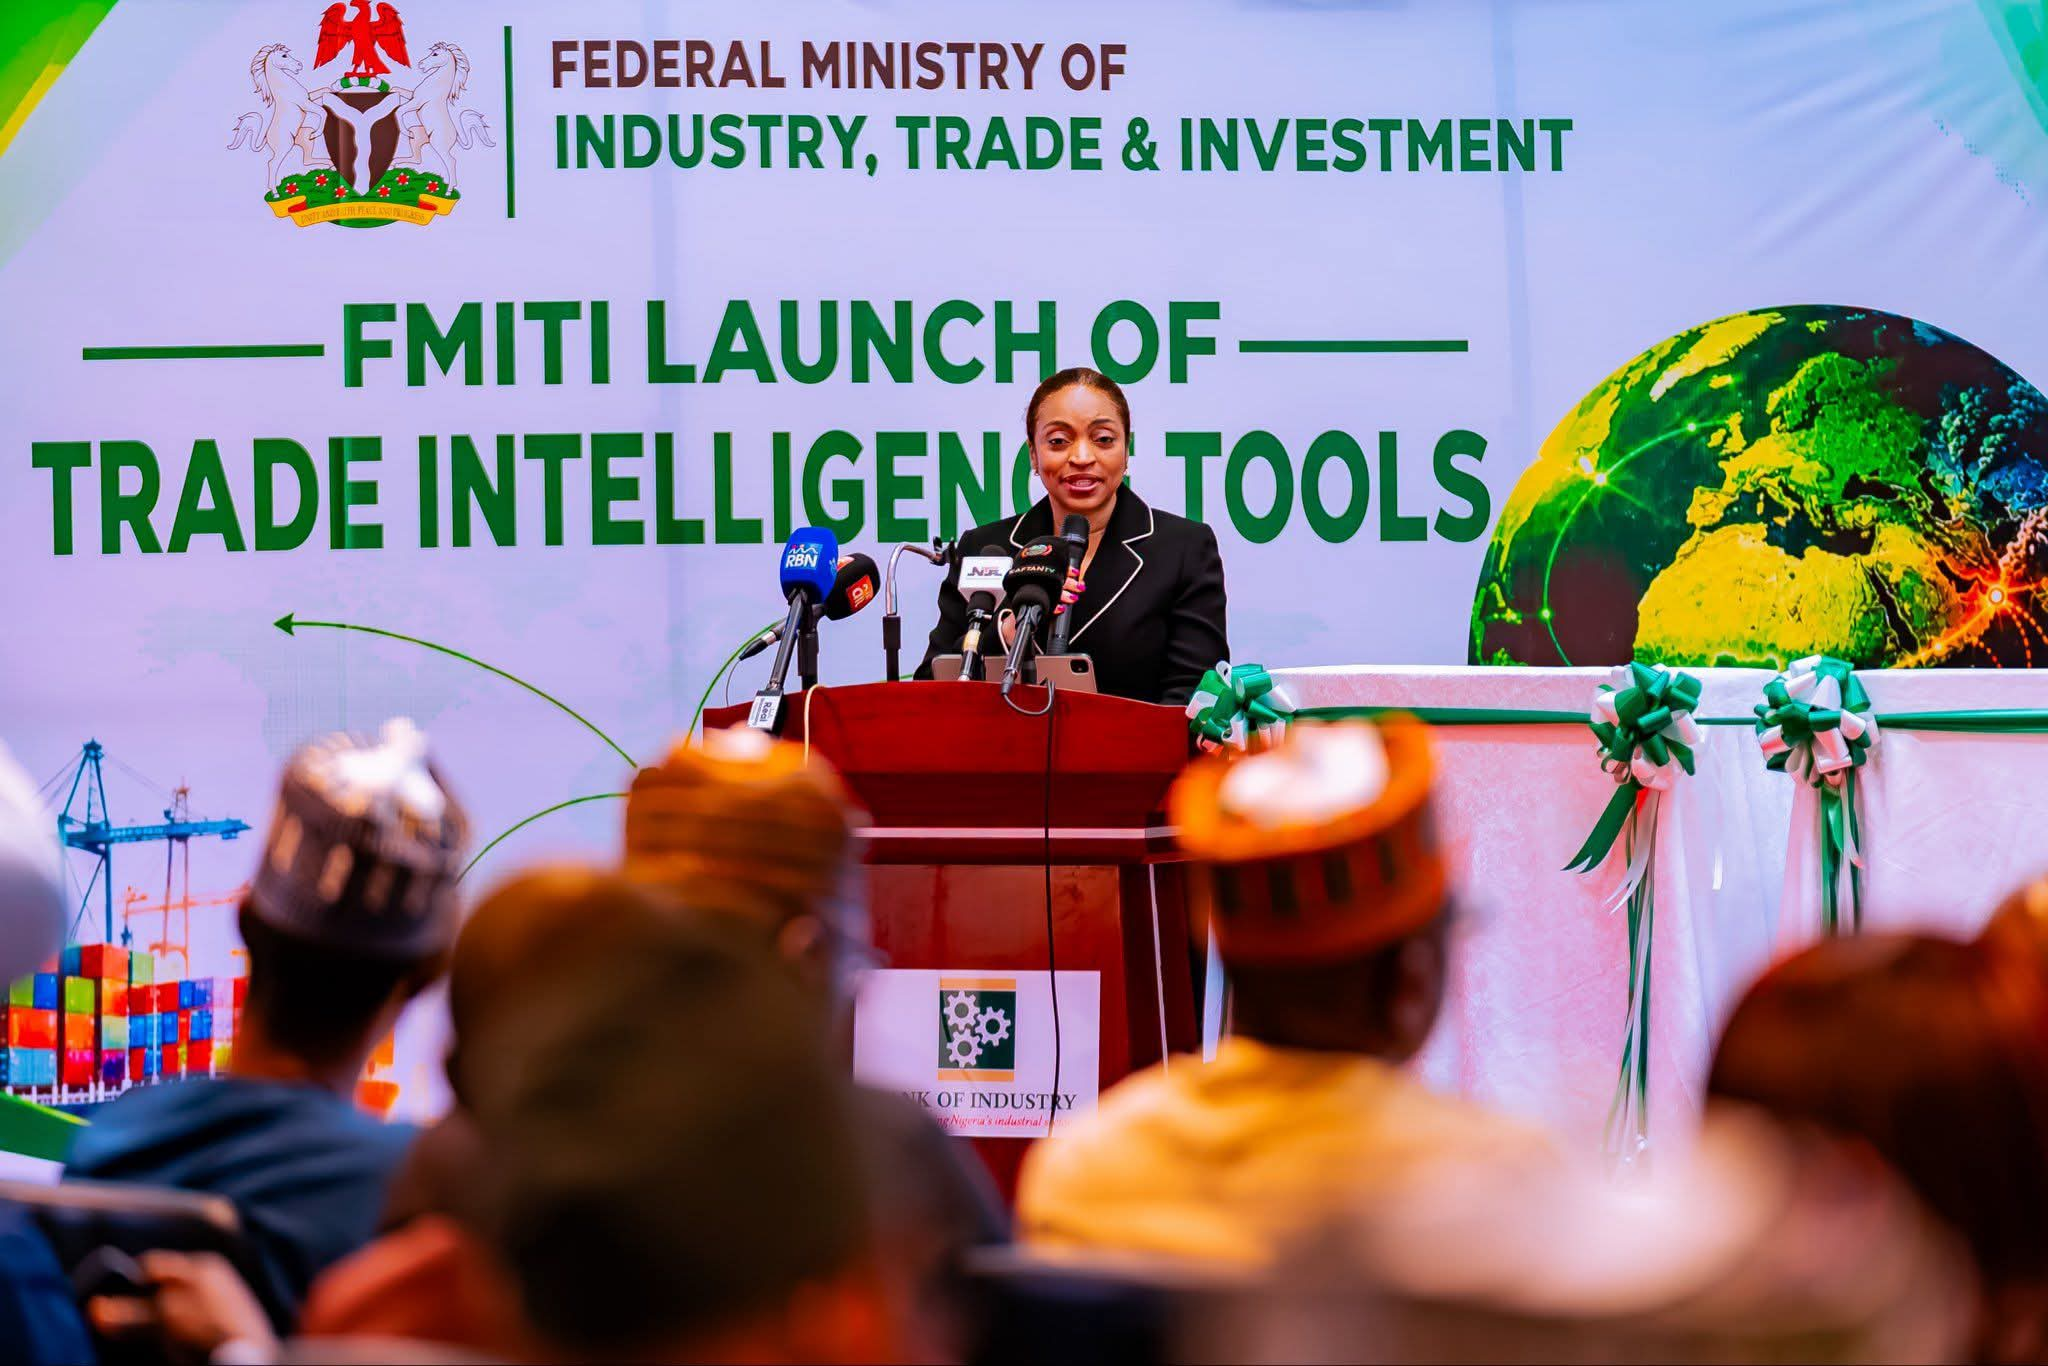
Nigeria’s external trade and payment position since 2024 has shifted from years of volatile, oil-dependent deficits to a multi-year streak of robust current account and trade surpluses.
Historical economic data from 2000 to 2026, sourced from the Central Bank of Nigeria (CBN), the National Bureau of Statistics (NBS), and CEIC Data, validate the long-term structural evolution of Nigeria’s external balance. This trajectory demonstrates a shift from volatile, single-commodity dependence into a sustained multi-year streak of robust current account and merchandise trade surpluses.
Between the years 2000 and 2014, a period described as the global commodity super-cycle, Nigeria maintained large external surpluses driven almost entirely by crude oil exports. Current account surpluses routinely averaged between 5% and 15% of Gross Domestic Product (GDP). It reached a historical quarterly high of +$10.38 billion in Q2 2008 and peaked at over $29 billion annually in full year 2008. Sustained high global crude oil prices drove the surplus. We estimate that the accumulation of these surpluses between 2001 and 2008 was enough to prompt new developmental curves in a diversified Nigerian economy.
Where the Surplus Funds Went:
Rather than direct the entirety of the commodity windfall into long-term industrial infrastructure and enable a diversified non-oil-based economy, the surplus capital was deployed by the administrations of Olusegun Obasanjo, Umar Musa Yar’adua and Goodluck Jonathan (1999 to 2015) into consumption-focused foreign reserve accumulation and a sovereign debt clearance, while developmental opportunities and advantages were ignored.
For context, we tracked the growth of Nigeria’s current accounts and reserves. Gross foreign reserves expanded from under $8 billion in 2000 to an all-time peak of $62 billion in September 2008; this provided short-term external shock absorption while Obasanjo’s administration, between 2005 and 2006, used approximately $12 billion of its accumulated reserves to clear a total of $30 billion in external debt owed to Paris Club creditors. This significantly lowered the sovereign debt burden.
To take advantage of the increased federation revenue, the Excess Crude Account (ECA) was established in 2004. The account peaked at $22 billion in 2008. In 2011, $1 billion was transferred from the ECA to set up the Nigeria Infrastructure Advisory Fund, Future Generations Fund, and Stabilisation Fund, all components of the Nigeria Sovereign Wealth Fund.
On the surface, the savings and debt clearance policies looked good, but the economy soon unravelled. Because the ECA lacked firm constitutional backing, State Governors frequently challenged the central government’s right to withhold oil revenues.
Between 2008 and 2014, regular distributions to federal, state, and local government council areas slashed the ECA from $22 billion down to under $3 billion. The money so shared was utilised primarily for recurrent expenditure (public sector salaries, administrative overheads) rather than capital investments.
The then management of the Central Bank of Nigeria (CBN) also used the surplus foreign exchange inflows to peg, or artificially support, the exchange rate, funding cheap dollars for non-oil consumer goods imports while rerouting billions of dollars in foreign exchange to subsidise imported Premium Motor Spirit (petrol). The trade surplus was effectively spent on imported fuel consumption rather than domestic refining.
Impact on the Larger Economy:
While the windfall generated temporary GDP expansion, which averaged 6% to 8% growth annually, and expanded the country’s urban service sector like banking, telecommunications, and trade, it failed to alter Nigeria’s fundamental economic structure. Oil and gas continued to account for over 90% of export receipts and over 70% of government revenue throughout the super-cycle.
During that same period, crucial economic enablers such as national grid power, intermodal freight rail, critical roads and deep-sea ports remained severely underfunded. This drove up operational costs and constrained domestic manufacturing. Domestic refineries were left in disrepair.
As a result, Nigeria spent a massive portion of its oil receipts importing refined petroleum products back into the country. Because surpluses were spent or distributed rather than converted into self-sustaining infrastructure and industrial assets, the economy remained fully exposed to global oil price volatility.
Thus, when crude prices crashed in late 2014, Nigeria immediately slid into a currency crisis and, by 2016, its first major recession in decades.
In summary, the windfall created short-term liquidity, but no effort was made to convert it into long-term capital assets, industrial output, or export diversification.
By the end of 2014, estimates of the population living in poverty in Nigeria ranged from 45% to 53%. This put the total number of extremely poor Nigerians between 80 million and 93 million in 2014.
Structural Volatility and Multi-Year Deficits (2015–2021)
Beginning in the last quarter of 2014, a combination of global crude price crashes, oil production disruptions, currency overvaluation, and soaring fuel import costs plunged Nigeria’s external balance into structural deficits.
The country recorded consecutive annual current account deficits between 2019 and 2021. According to CBN Balance of Payments (BoP) data, the current account fell to -$17.0 billion (~-4.0% of GDP) in 2019 and -$15.8 billion in 2020. The quarter ending December 2019 recorded an all-time-low current account deficit of -$6.12 billion.
2023 – Present: Years of Reforms, Structural Turnaround & Multi-Year Streak:
Beginning in 2022 and accelerating through 2024 to 2026, FX market realignments, domestic refiner integration, and aggressive non-oil export expansion converted the external position into a multi-year surplus streak.
Our analysis found that the near four years of the Federal administration mark a record of consistent current account surpluses, underpinned by an aggressive strategy to not only drive FDI but also link it to domestic macroeconomic stability with a medium- to long-term microeconomic impact.
This structural pivot stems from bold, yet painful market corrections initiated in 2023.
The corrections were driven primarily by the unification of the foreign exchange market and the elimination of the costly petrol subsidy.
While these policies initially triggered significant domestic inflation and currency depreciation, they successfully re-engineered Nigeria’s external balance sheets and attracted renewed global investor attention.
To understand the full scope of Nigeria’s capital recovery, it is crucial to analyse both where the money is flowing (Sector Breakdown) and the nature of the capital itself (Foreign Direct Investment – FDI vs Foreign Portfolio Investment- FPI).
Macro-Level FDI Inflows (Actualised Capital).
According to tracking data from the UNCTAD World Investment Report 2026, Nigeria’s actualised physical FDI flows experienced a sharp drop initially due to transitional volatility, followed by a substantial recovery.










Traffickers Now Targeting Women At Gyms, NAPTIP Warns

FG, Enugu align on agro-industrialisation, market access to boost food security

EFCC Probes Ex-Access Bank Manager Over Alleged ₦515 Million Diversion From Customer’s Account

“Courts Must Guard Their Independence, Impartiality And Integrity” — NDC Warns After Atiku’s Candidacy Is Nullified

Gov Abiodun declares Ogun ready for state police

Former Cross River PDP chair doubts party’s 2027 chances
Tinubu to embark on two-day official visit to Akwa Ibom, Rivers

Ex-Air Force spokesperson identifies ‘flaw’ affecting Nigeria’s multi-trillion naira defence budget

INVESTIGATION: How Anthony Kila falsified all his academic qualifications – from Bachelor’s to Doctorate

Customer Service Week: Inside How Jumia Is Using Technology To Go The Extra Mile For Shoppers

Google opens AI-content detector to enable verification

Kayefi headlines Tales & Tunes as ID Cabasa leads music direction in Sheffield

Ogaga Ifowodo wins $100,000 Nigeria Prize for Literature

How Lagos Families Are Allegedly Buying Contaminated Meat In Dirty Conditions At Mushin, Oshodi, Mile 12, Surulere Markets

UK migrant workers wear chains, sing Asa’s ‘Jailer’ to protest proposed visa reforms

How Houthi military aggression in Red Sea threatens Africa
-

 News7 days ago
“We Will Continue To Pursue Hall” — US Offers $5,000 Reward For Nigerian Woman Who Failed To Report To Prison
-

 Special Reports2 days ago
ADC warns Sokoto govt, vows to hold governor responsible for intimidation, violence against opposition
-
Top Stories7 days ago
“Ebola Outbreak Is Not Yet Under Control” — Africa CDC Warns As Confirmed Cases Exceed 10,200, Death Toll Surpasses 5,000
-
Special Reports7 days ago
EXCLUSIVE: NSCDC ‘s Niger commandant fabricated ‘disease outbreak’ to cover up 33 deaths in cell – Report
-
Special Reports7 days ago
How PR Executes Expectation Setting Without Stakeholders’ Knowledge
-
Business6 days ago
“We’re Covering Every Loss” — Binance Sets Aside $6.34bn After Record Crypto Hack Linked To North Korea As FBI Investigates
-
Special Reports7 days ago
“I Thought He Came To Settle The Fight” – Bariga NURTW Member Stabbed By Police Inspector Battling For Recovery In FMC Oyingbo
-
Special Reports7 days ago
Binance reserves $6.34bn to cover stolen assets after cyberattack – CEO